
Understanding AI Performance with Agent Monitoring
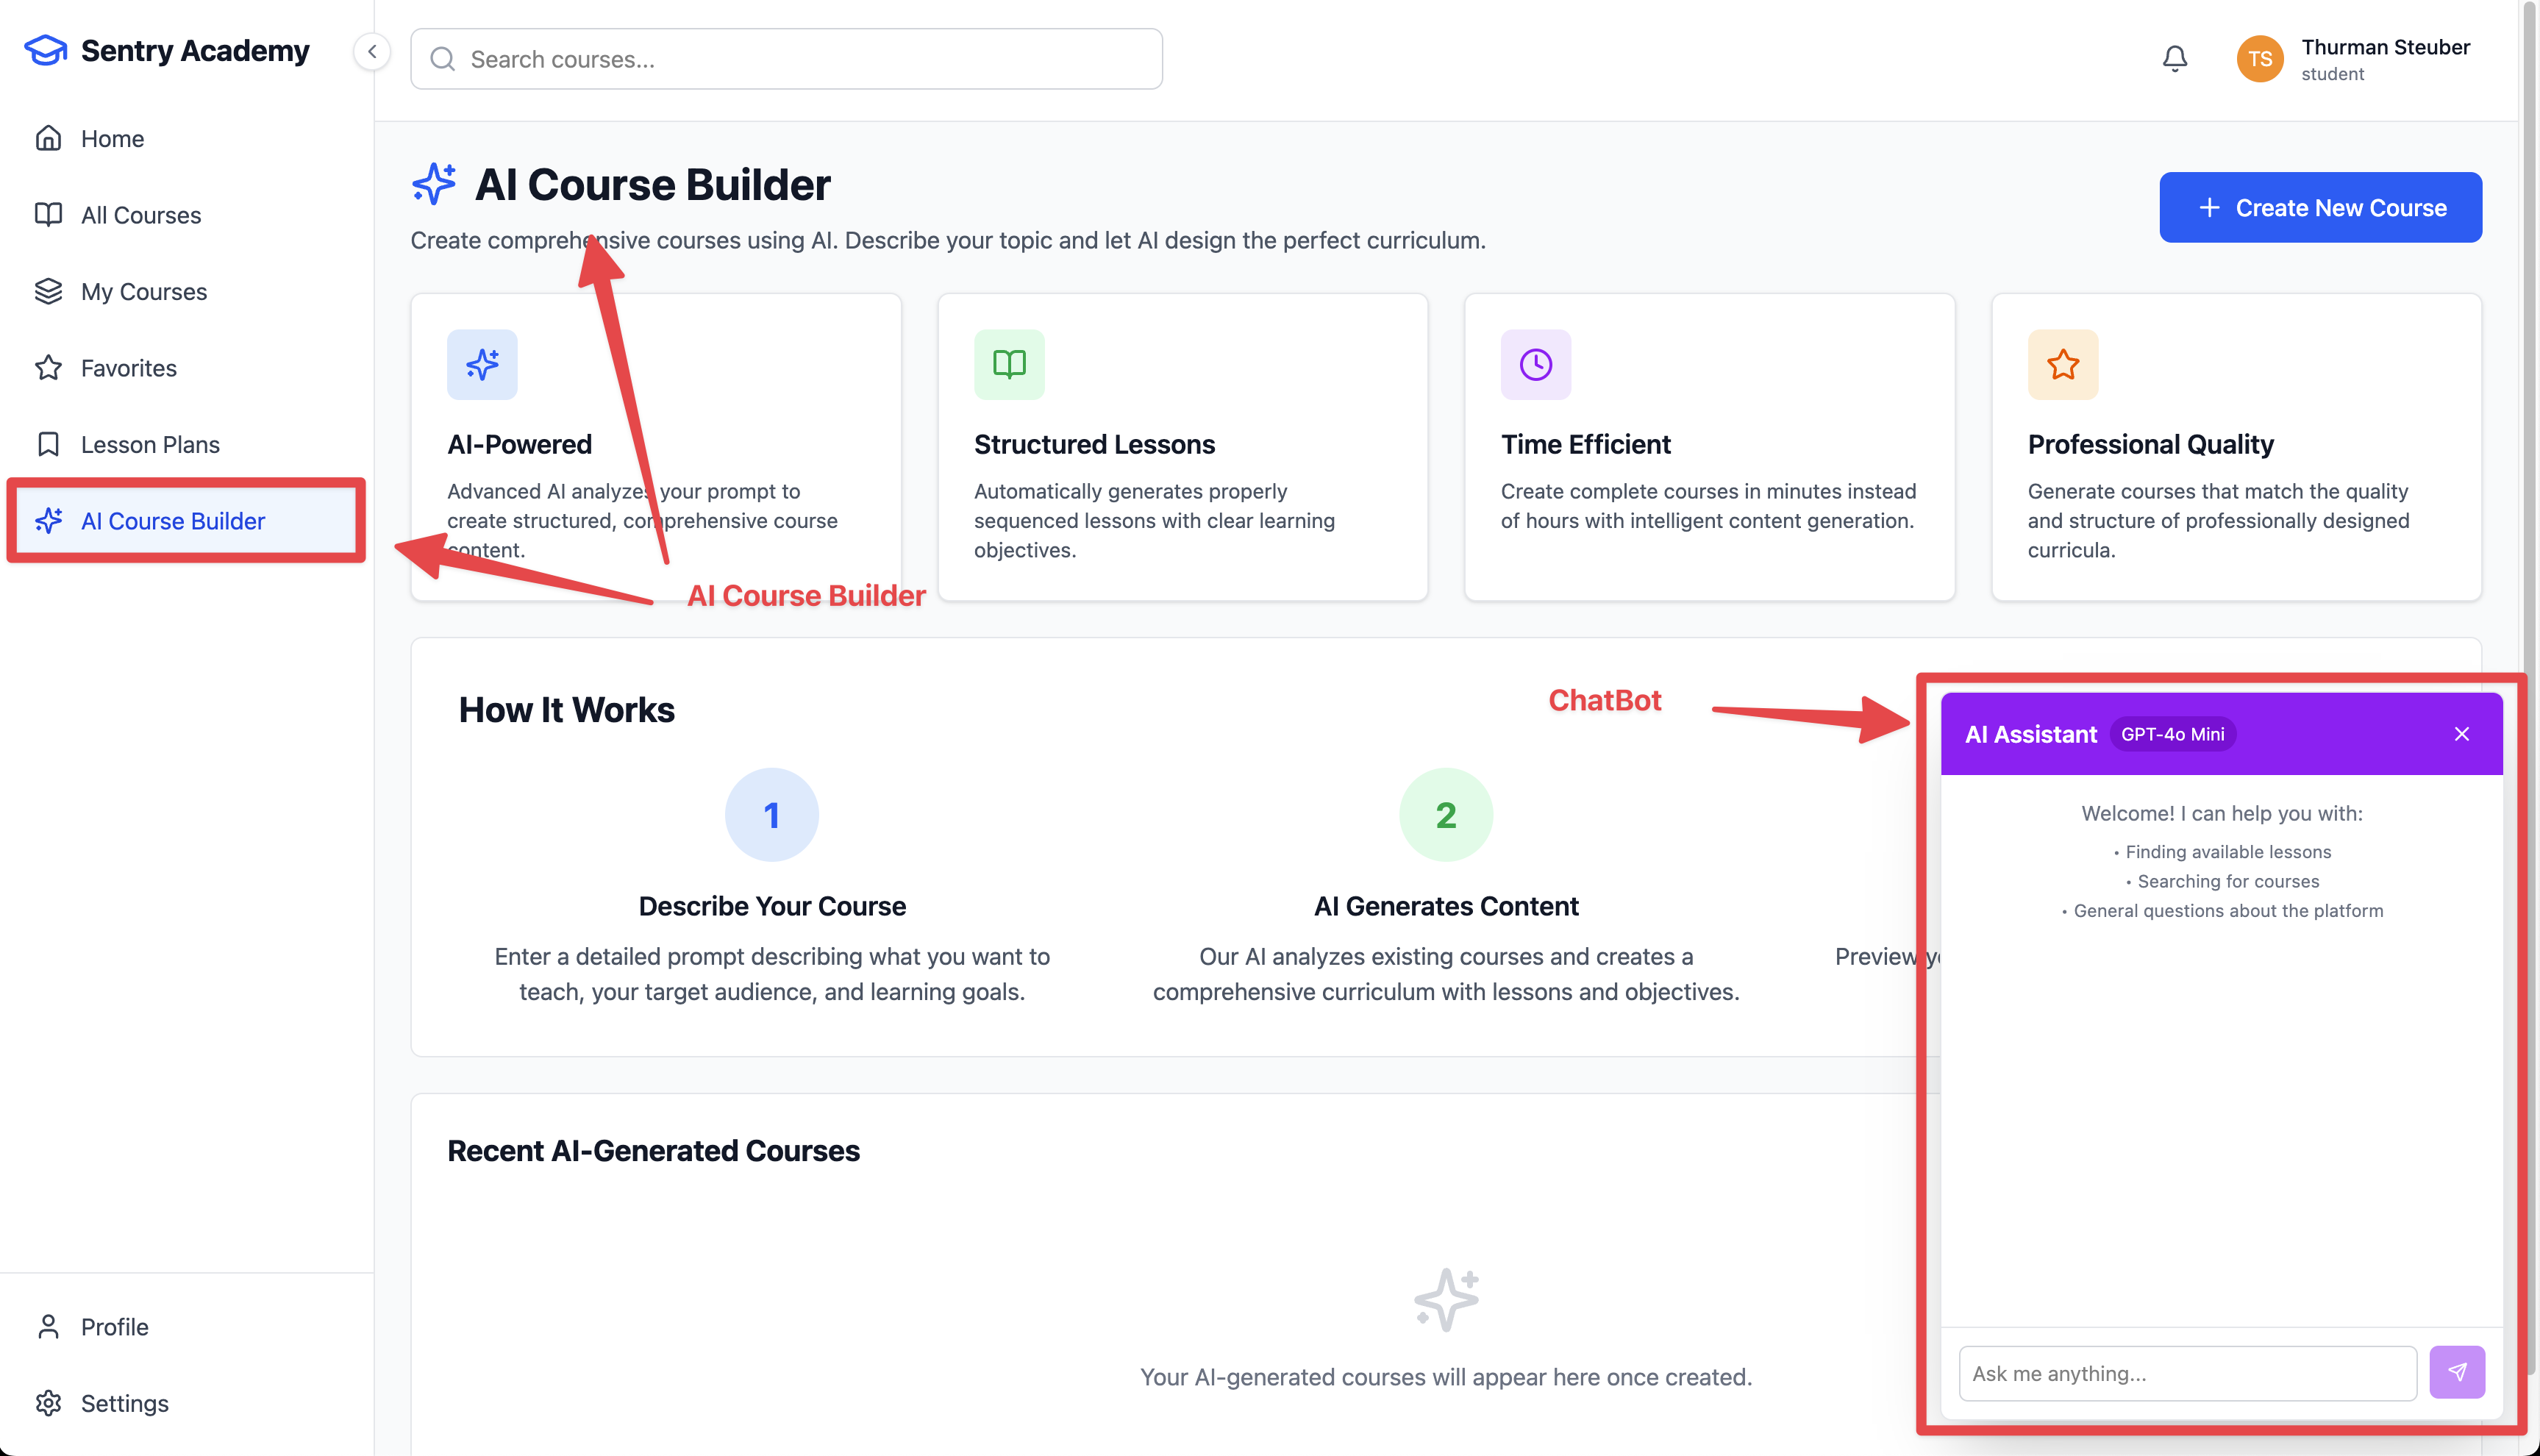
We can search for courses now! Sentry Academy features a few new AI features to help you get the most out of a learning platform. We have a chatbot, as well as a course creation assitant that is powered by ChatGPT.
Sentry recently released AI Agent Monitoring, which gives you a view into the performance and debugging for AI Agents. This feature gives you a few new capabilities in sentry:
- Direct integration with the AI SDK (from Vercel), OpenAI Agents SDKs
- Custom instrumentation options when out of the box SDK support isn’t available
- Views into LLM calls and tool performance
- Specialized trace view focused on input and output calls for AI
- End to end visibility across frontend, through the AI agents, and into any backend calls (i.e. database performance)
Learning Objectives
By the end of this module, you will:
- Know how to configure the AI SDK integration in Sentry
- See how to instrument your AI tool calls and text generation calls with Sentry
- Review the AI Agent Insights view in Sentry
- Explore AI related spans and performance information
Getting started with AI Agent Monitoring is straight forward. We need to…
- Enable the SDK integrations if applicable in our application. We’re using Node + the AI SDK from Vercel, so we need to update our Sentry config with the integration stanza
- Instrument our AI calls with the
experimental_telemetrycalls
Backend - Enabling the SDK Integration
Let’s start by enabling the SDK integration in Sentry. We’ll need to do this in our Sentry config for the server side.
-
Add the AI SDK Integration to the Sentry Initialization
Browse to the
/apps/server/instrument.tsfile and add the following to theSentry.initcall:integrations: [Sentry.vercelAIIntegration({recordInputs: true,recordOutputs: true,}),],Save this file and the app will reload to pick up the integration.
Configuring the Chat Bot for Agent Monitoring
-
Update the ChatBot with the
experimental_telemetryConfigurationNavigate to line
229in/apps/server/src/modules/chat/routes.tsand add theexperimental_telemetryconfiguration to thestreamTextcall:const result = await streamText({model: openai(actualModel),experimental_telemetry: {isEnabled: true,functionId: 'chatRequest',},messages: [Save this file, and now when calls are made to OpenAI from the ChatBot interface in Sentry, these calls will be monitored in AI Agent Monitoring.
-
Test the chat function in Sentry Academy
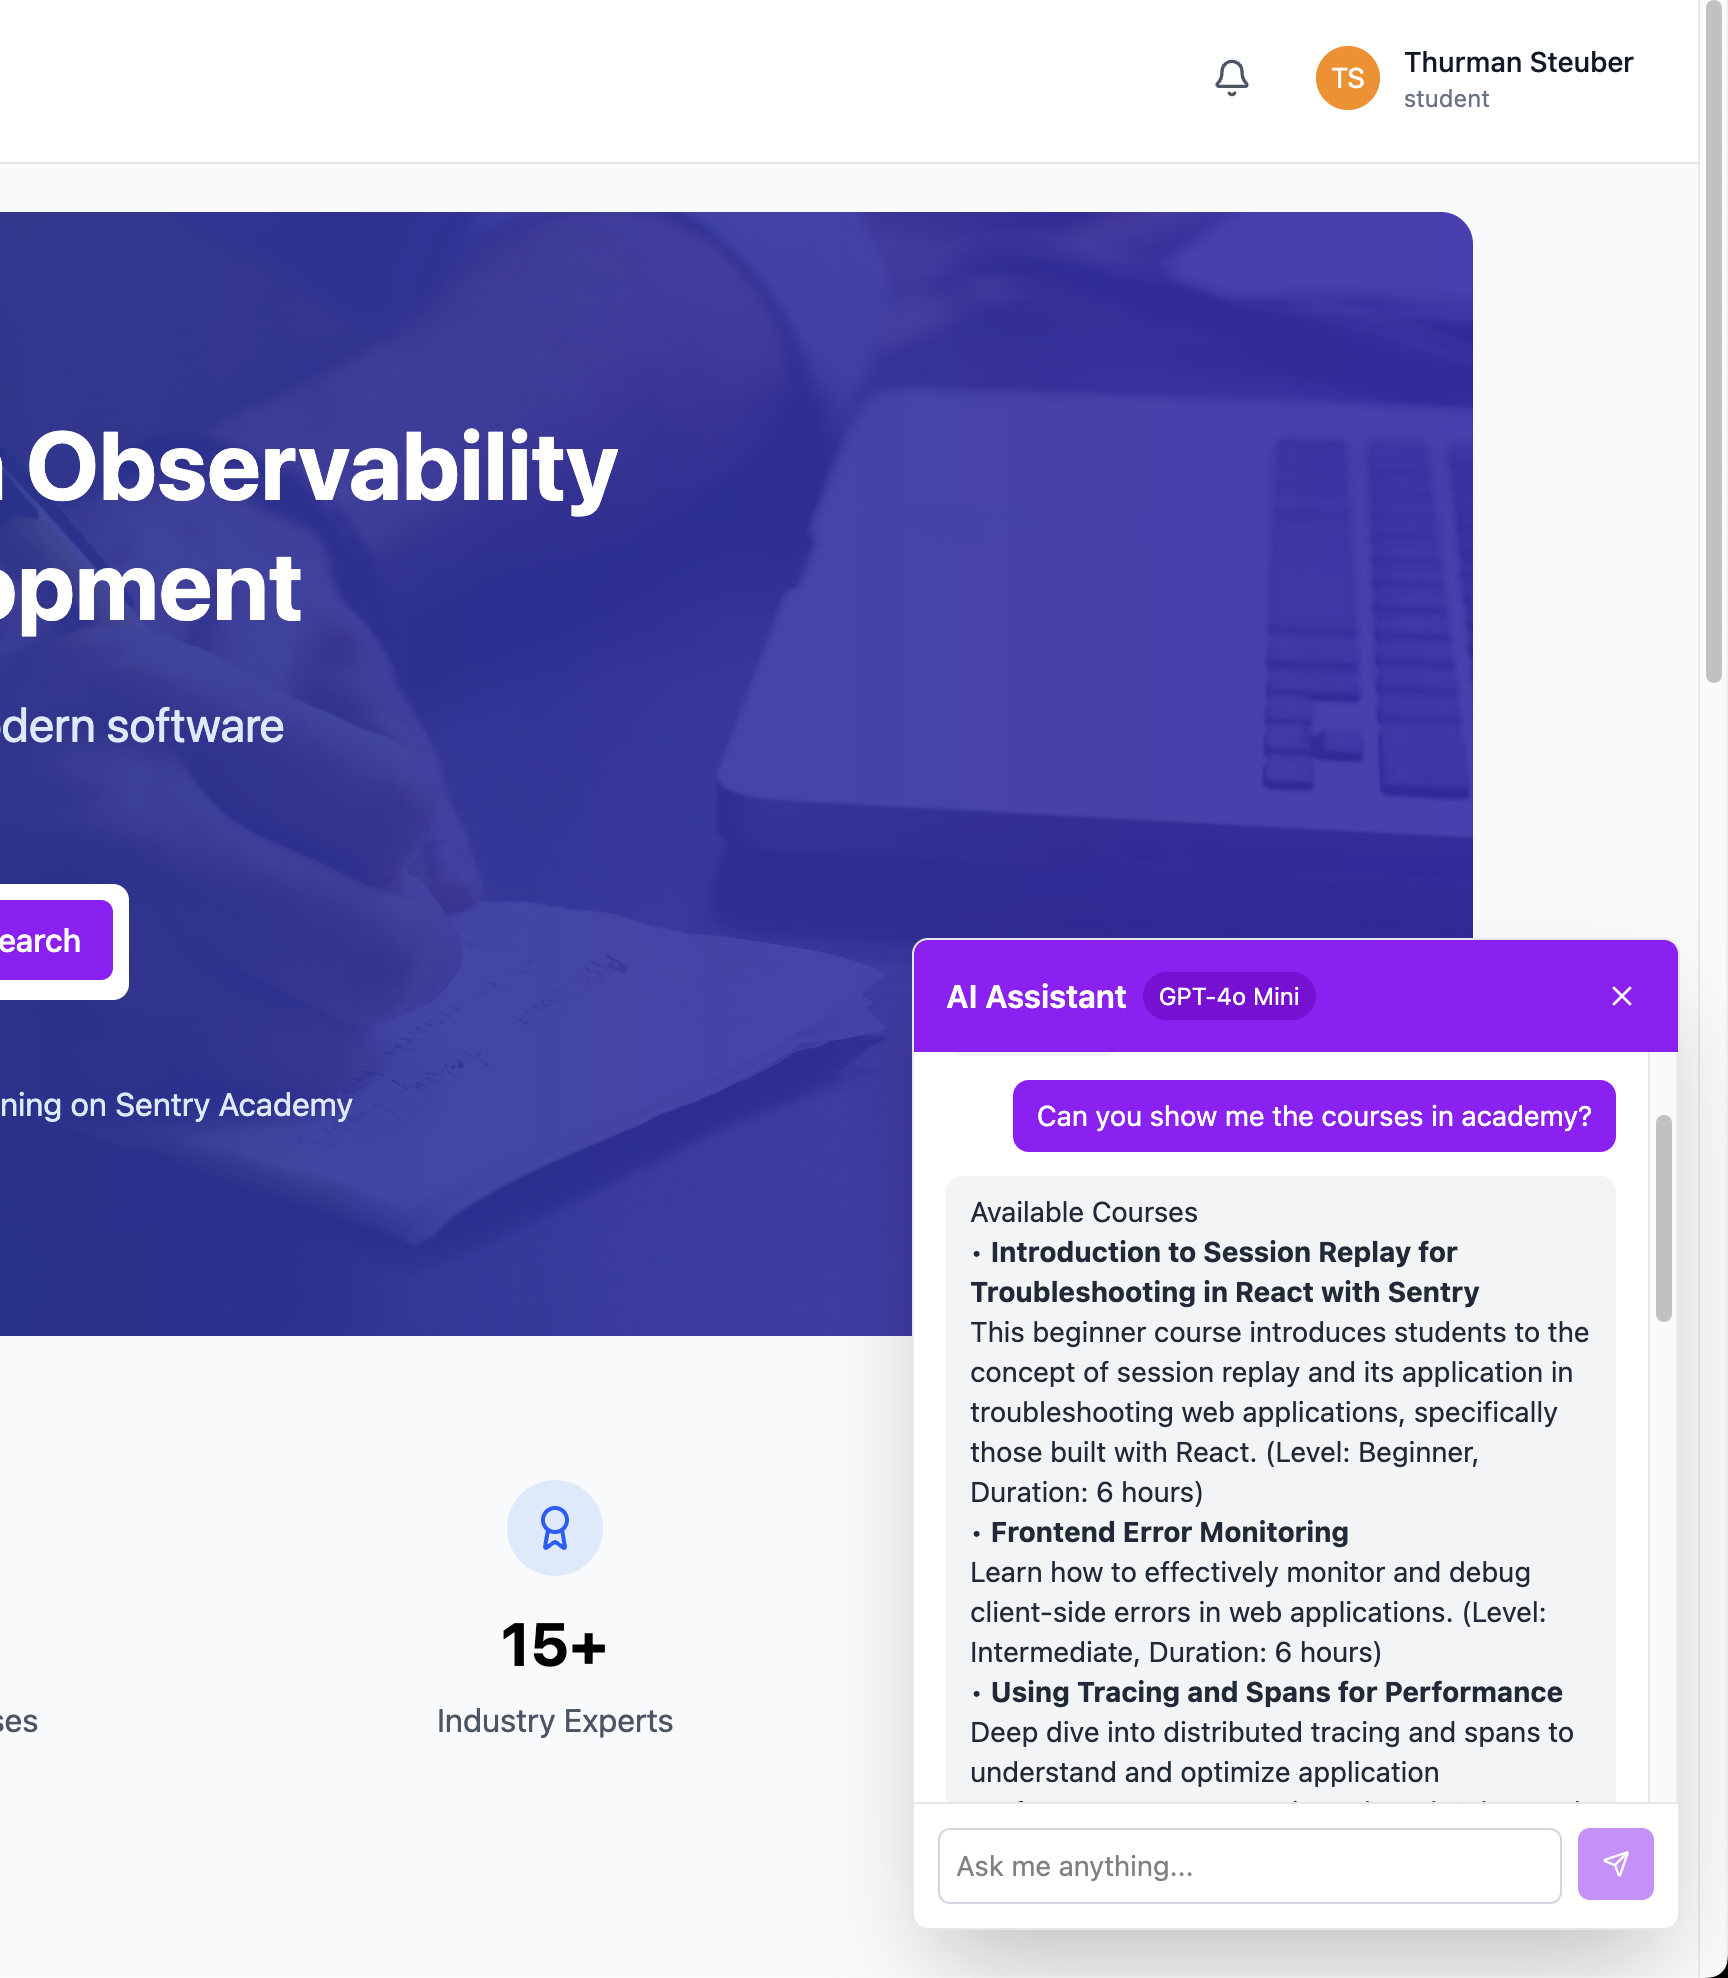
Click on the Chat Bot in the bottom right corner of the application and ask it to tell you about the courses available in Sentry Academy. Note: This might take 2 attempts; bugs happen.
-
Review the Results in AI Agent Monitoring
On the left navigation, select
Insights > AI Agentsand ensure you have the backend for your academy project selected. You should see a dashboard that looks similar to the below.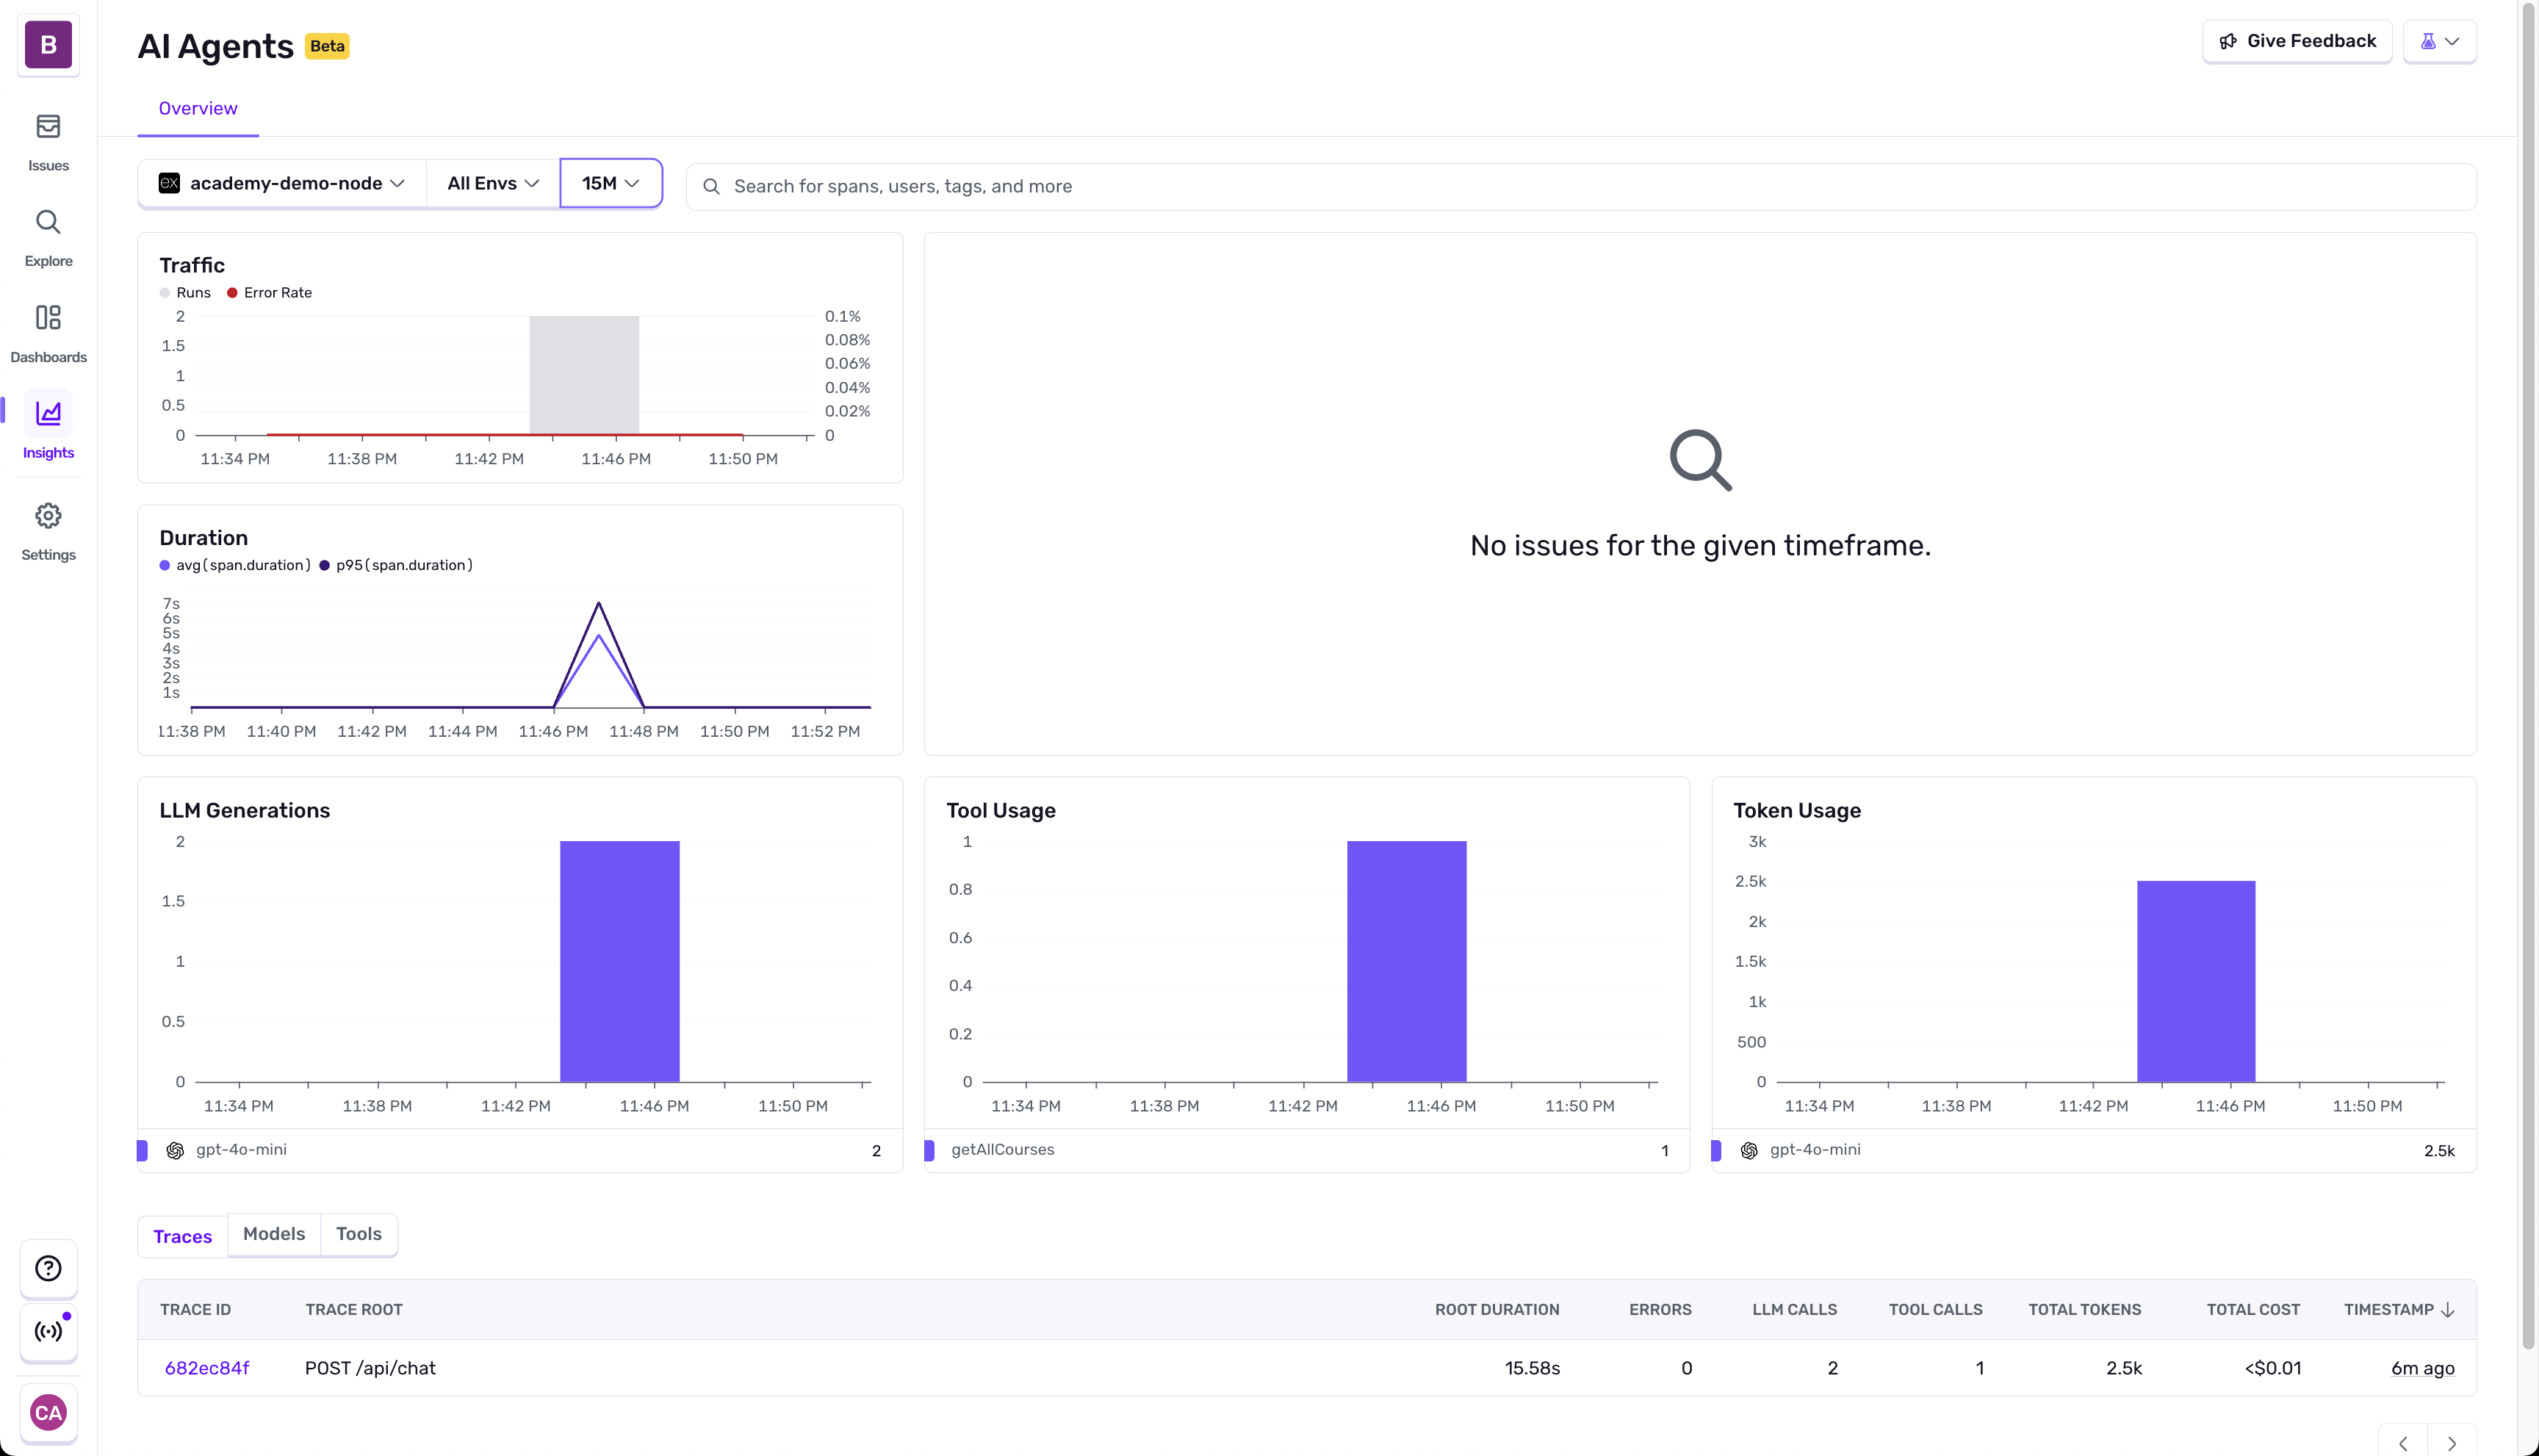
-
Review the Agent Trace View
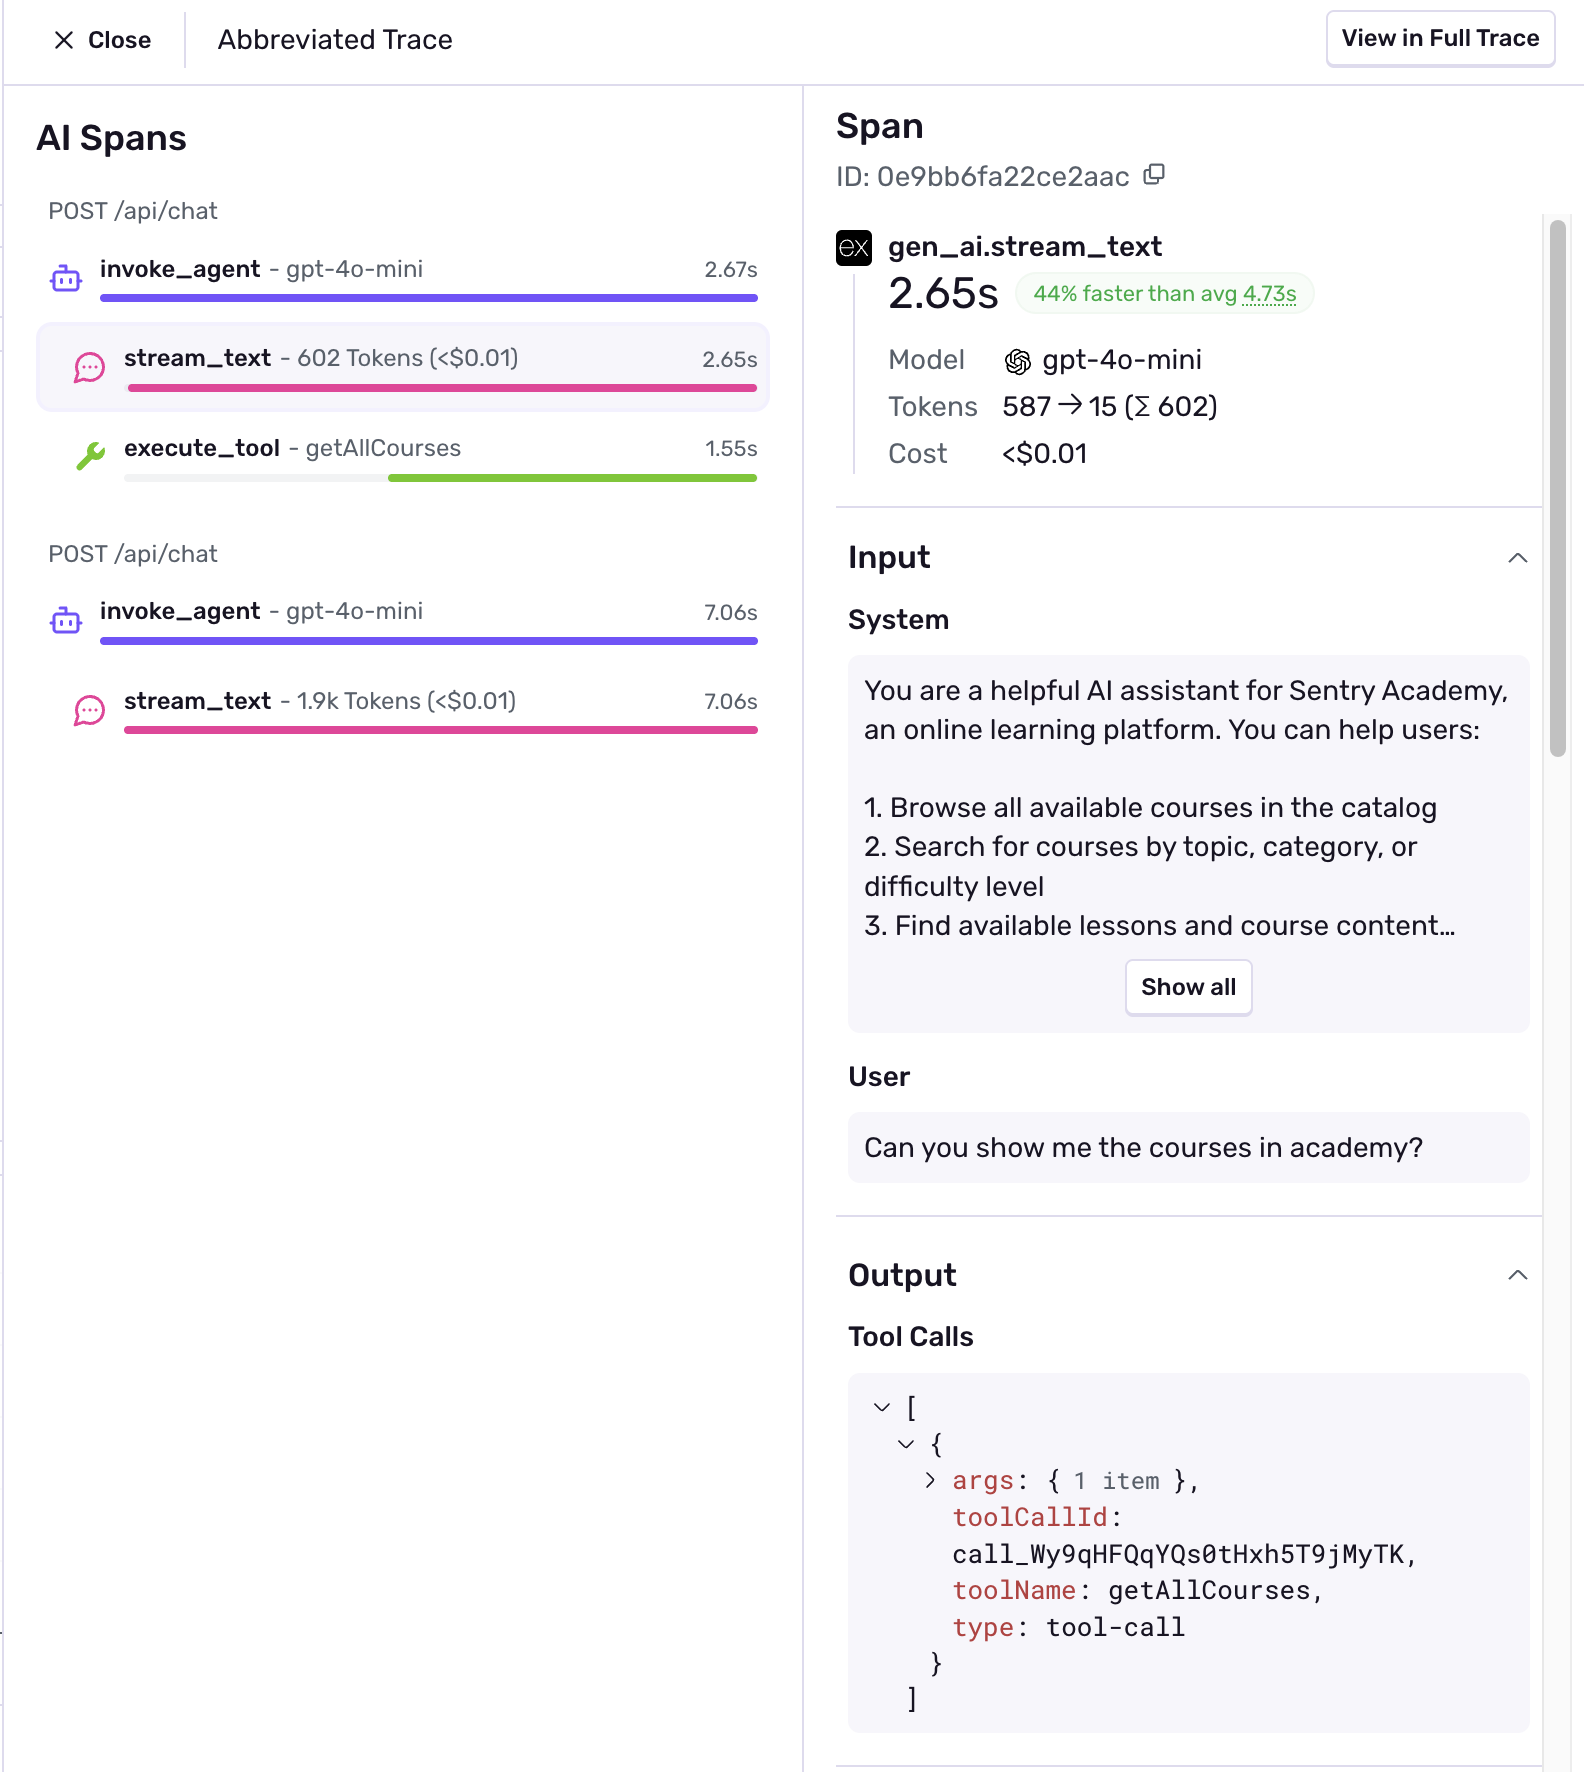
Select the trace on the bottom for the
/api/chatroute, you’ll see an abbreviated trace view display that shows all the AI interactions to took place when you made the request.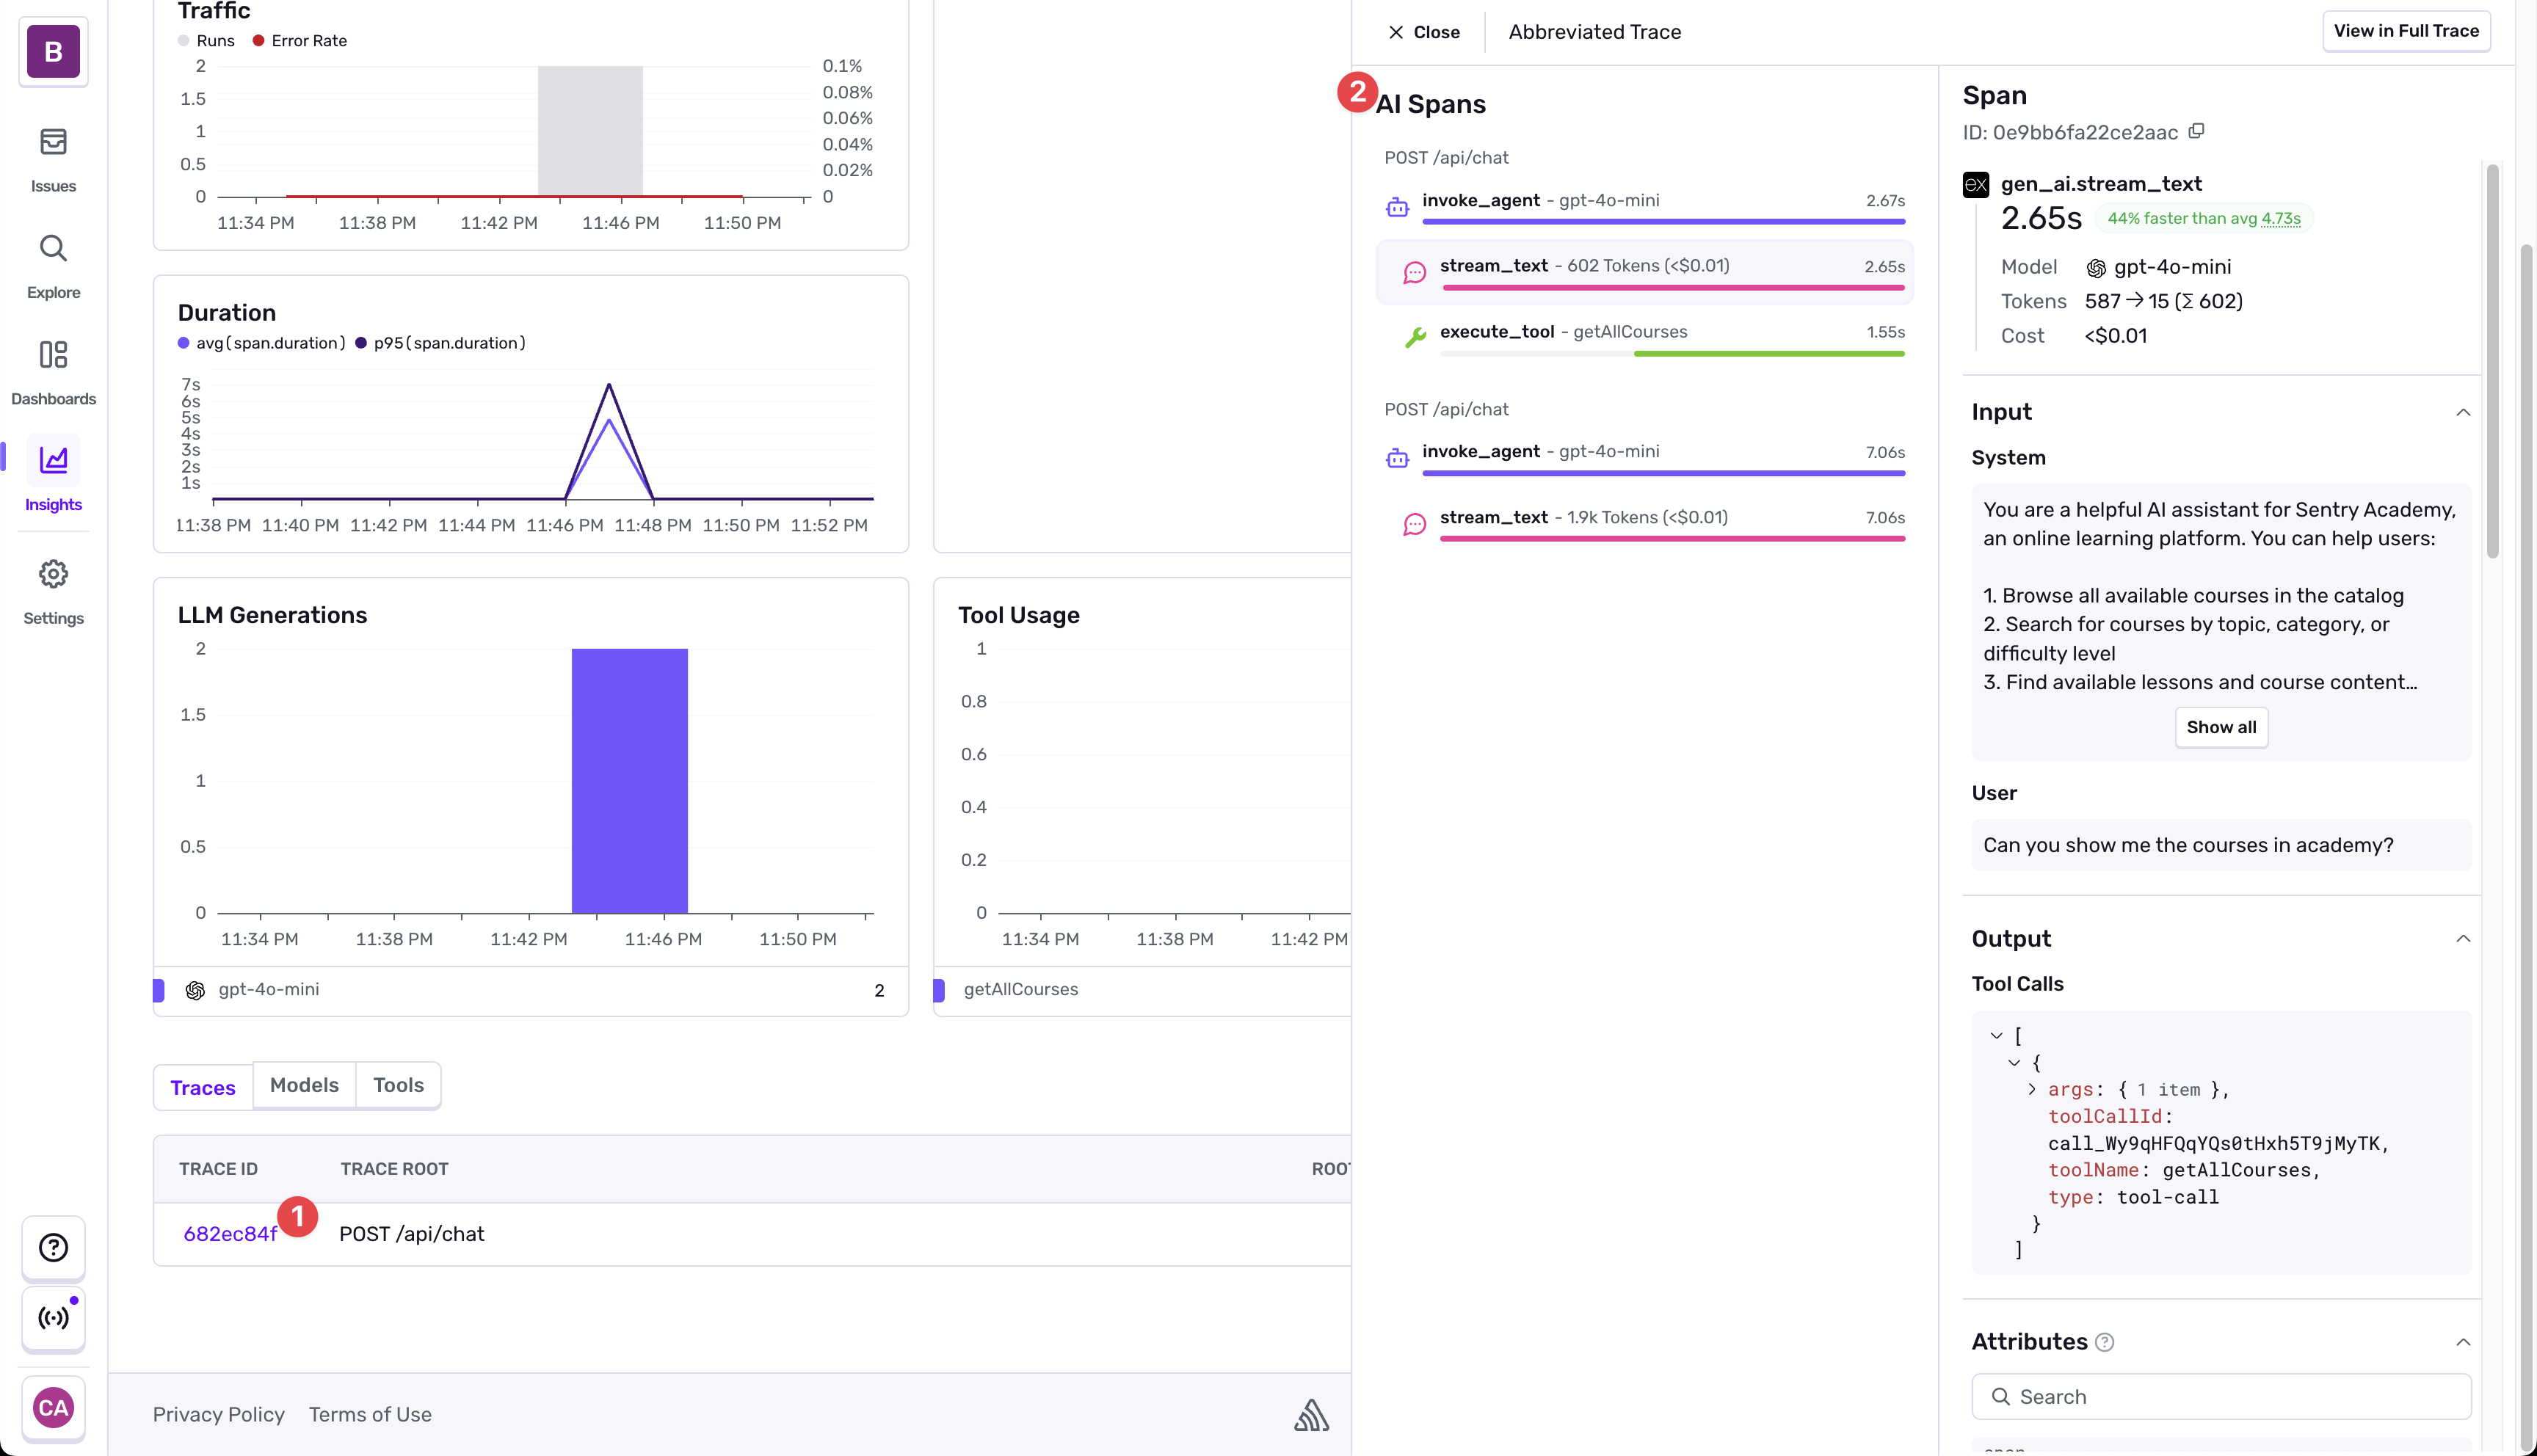
-
Review tool call spans
The tool call spans will show you input and output information for the calls. This makes it easier to understand what specific tool call was used, the system prompt that the agent recieved, and how your request influenced the tool call usage.
-
Explore the full trace waterfall
Clicking on the “View Full Trace” button on the top right of the trace view will take you to the full trace waterfall view. This view shows you the full trace of the request, including the AI agent calls, tool calls, and any backend calls.
This is the real strength of Sentry and AI Agent Monitoring - being able to understand the full performance across the entire stack of your application.
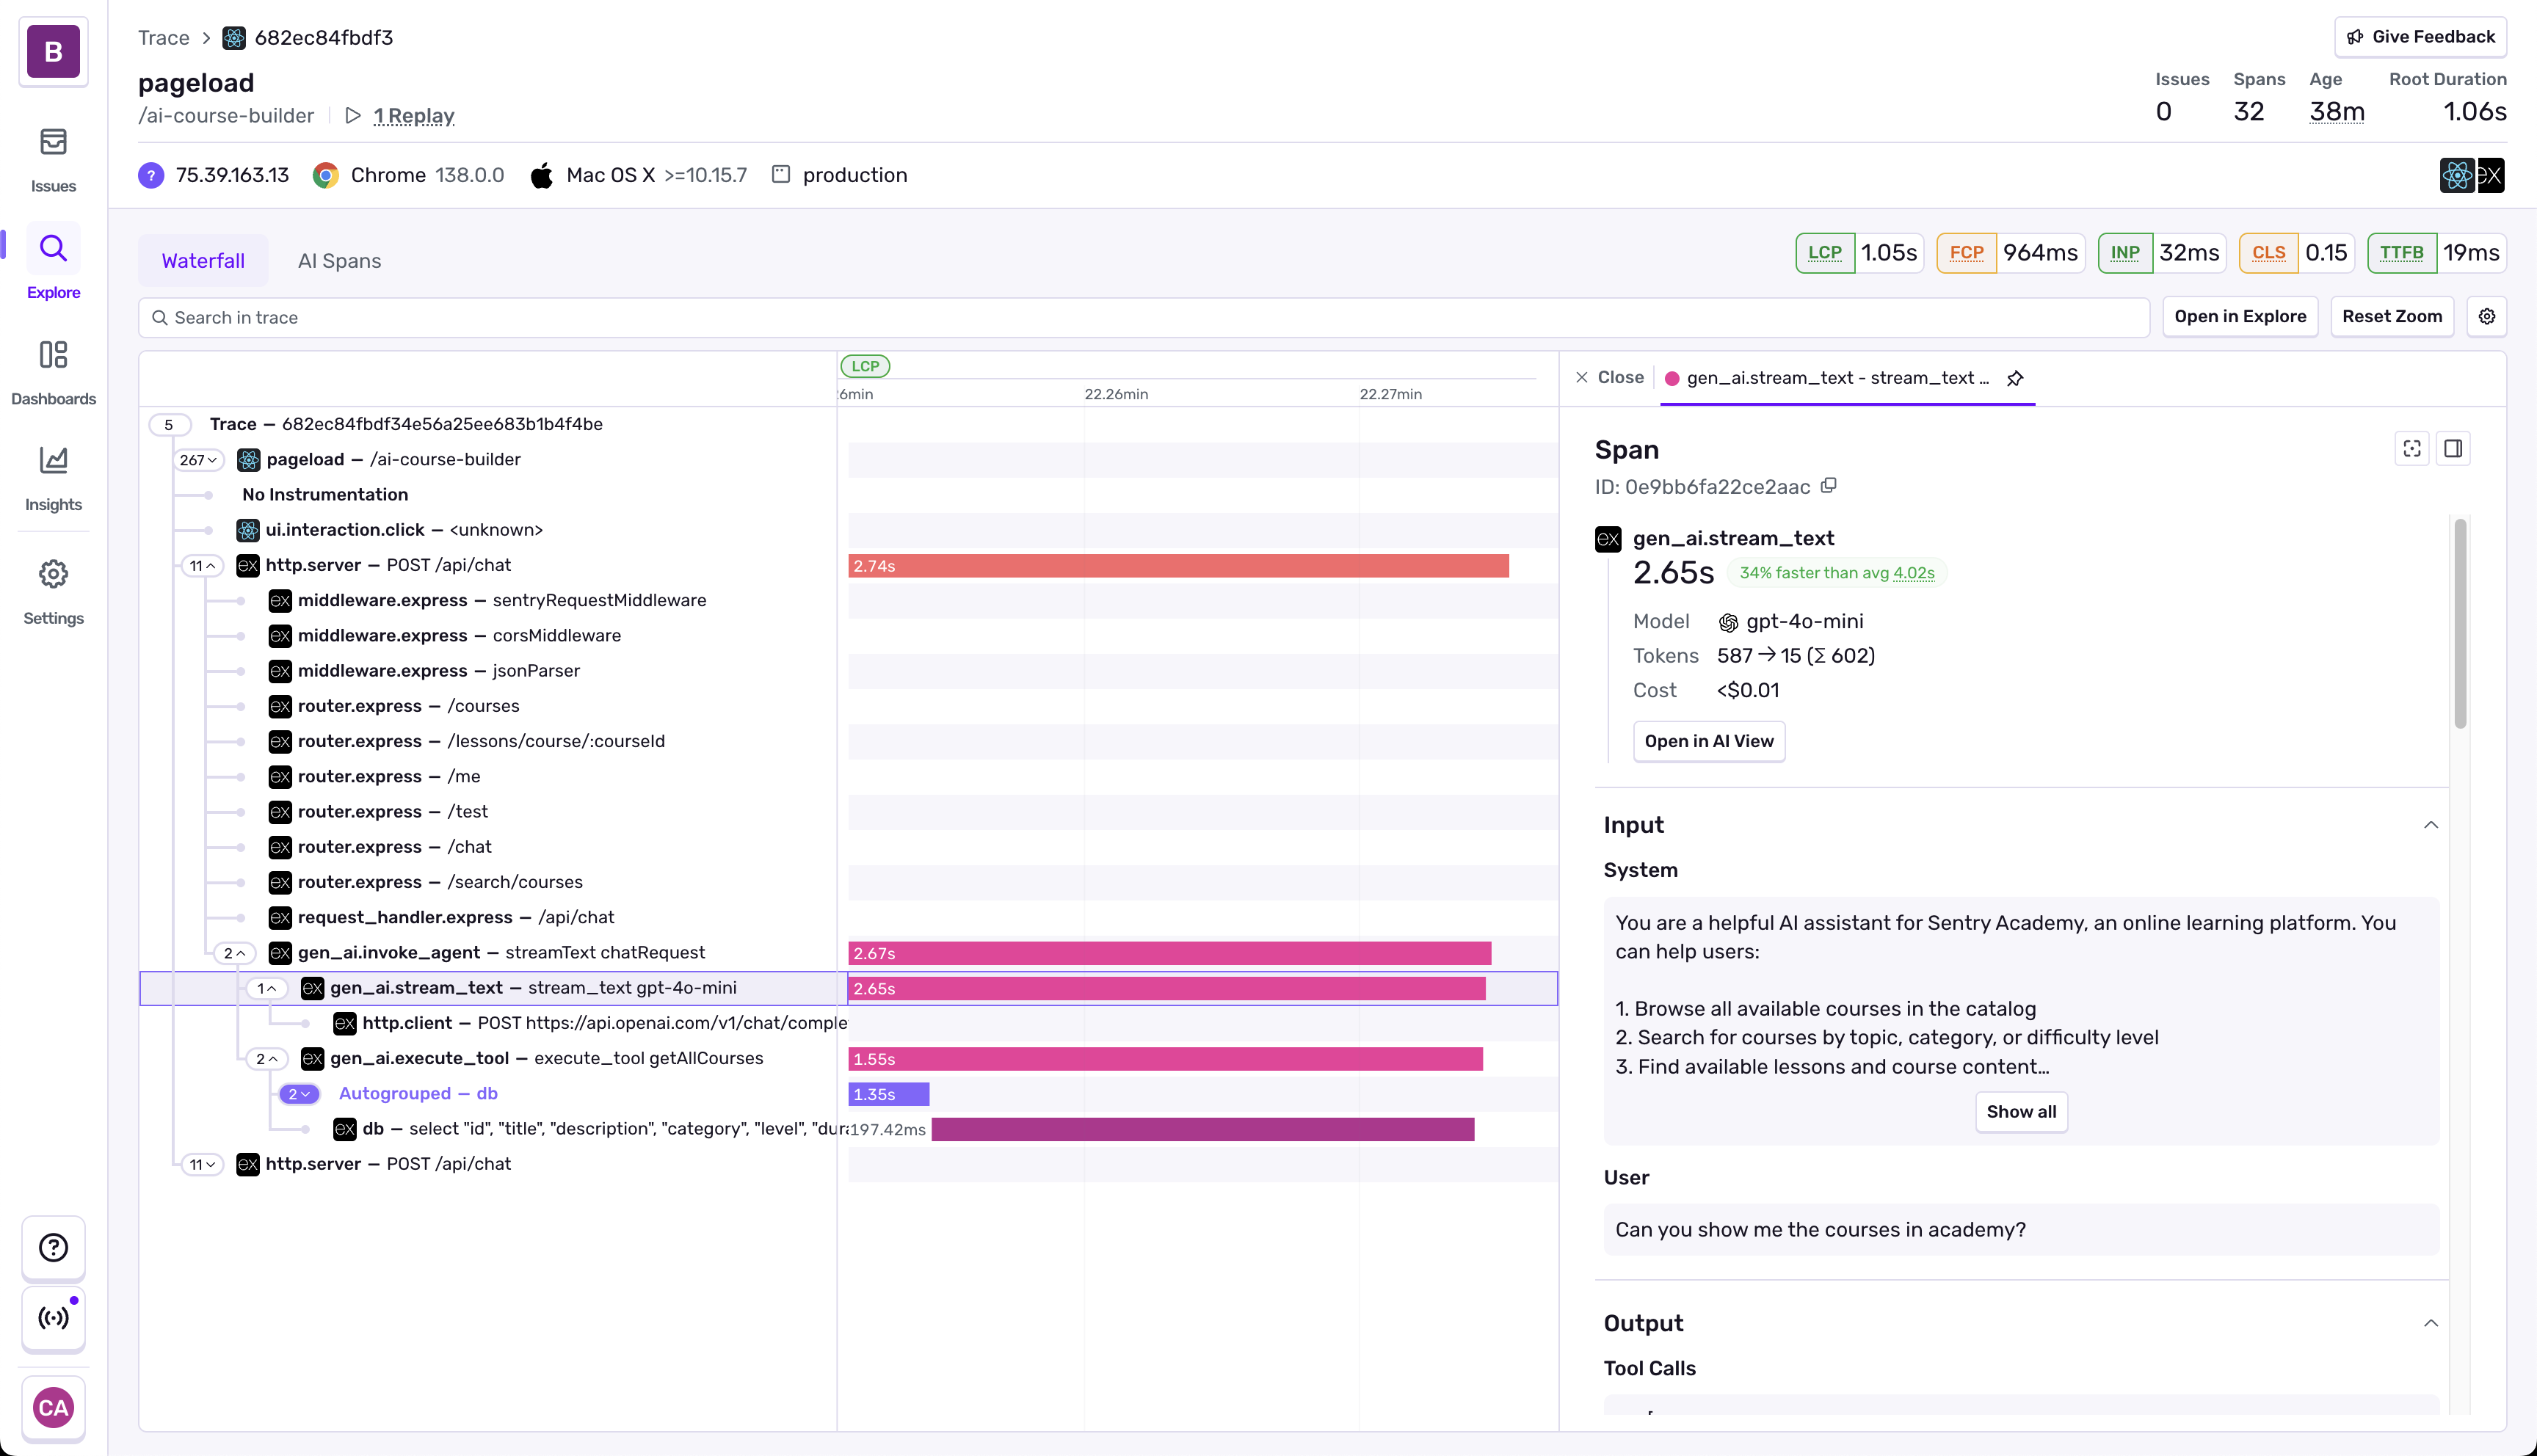
These spans can all be used to create alerts, dashboard views, and understand the full view of application performance across the stack.
Configuring Agent Monitoring for the AI Course Builder
We can quickly move through instrumenting the same flow for monitoring our course builder, which is a bit more complicated of an LLM call.
-
Enable the
experimental_telemetryConfiguration for the Course BuilderNavigate to the
/apps/server/src/modules/ai/routes.tsfile and add theexperimental_telemetryconfiguration to thestreamTextcall:const result = await streamText({model: openai('gpt-4o-mini'),experimental_telemetry: {isEnabled: true,functionId: 'generateCourse',},messages: [
Testing the AI Course Builder
-
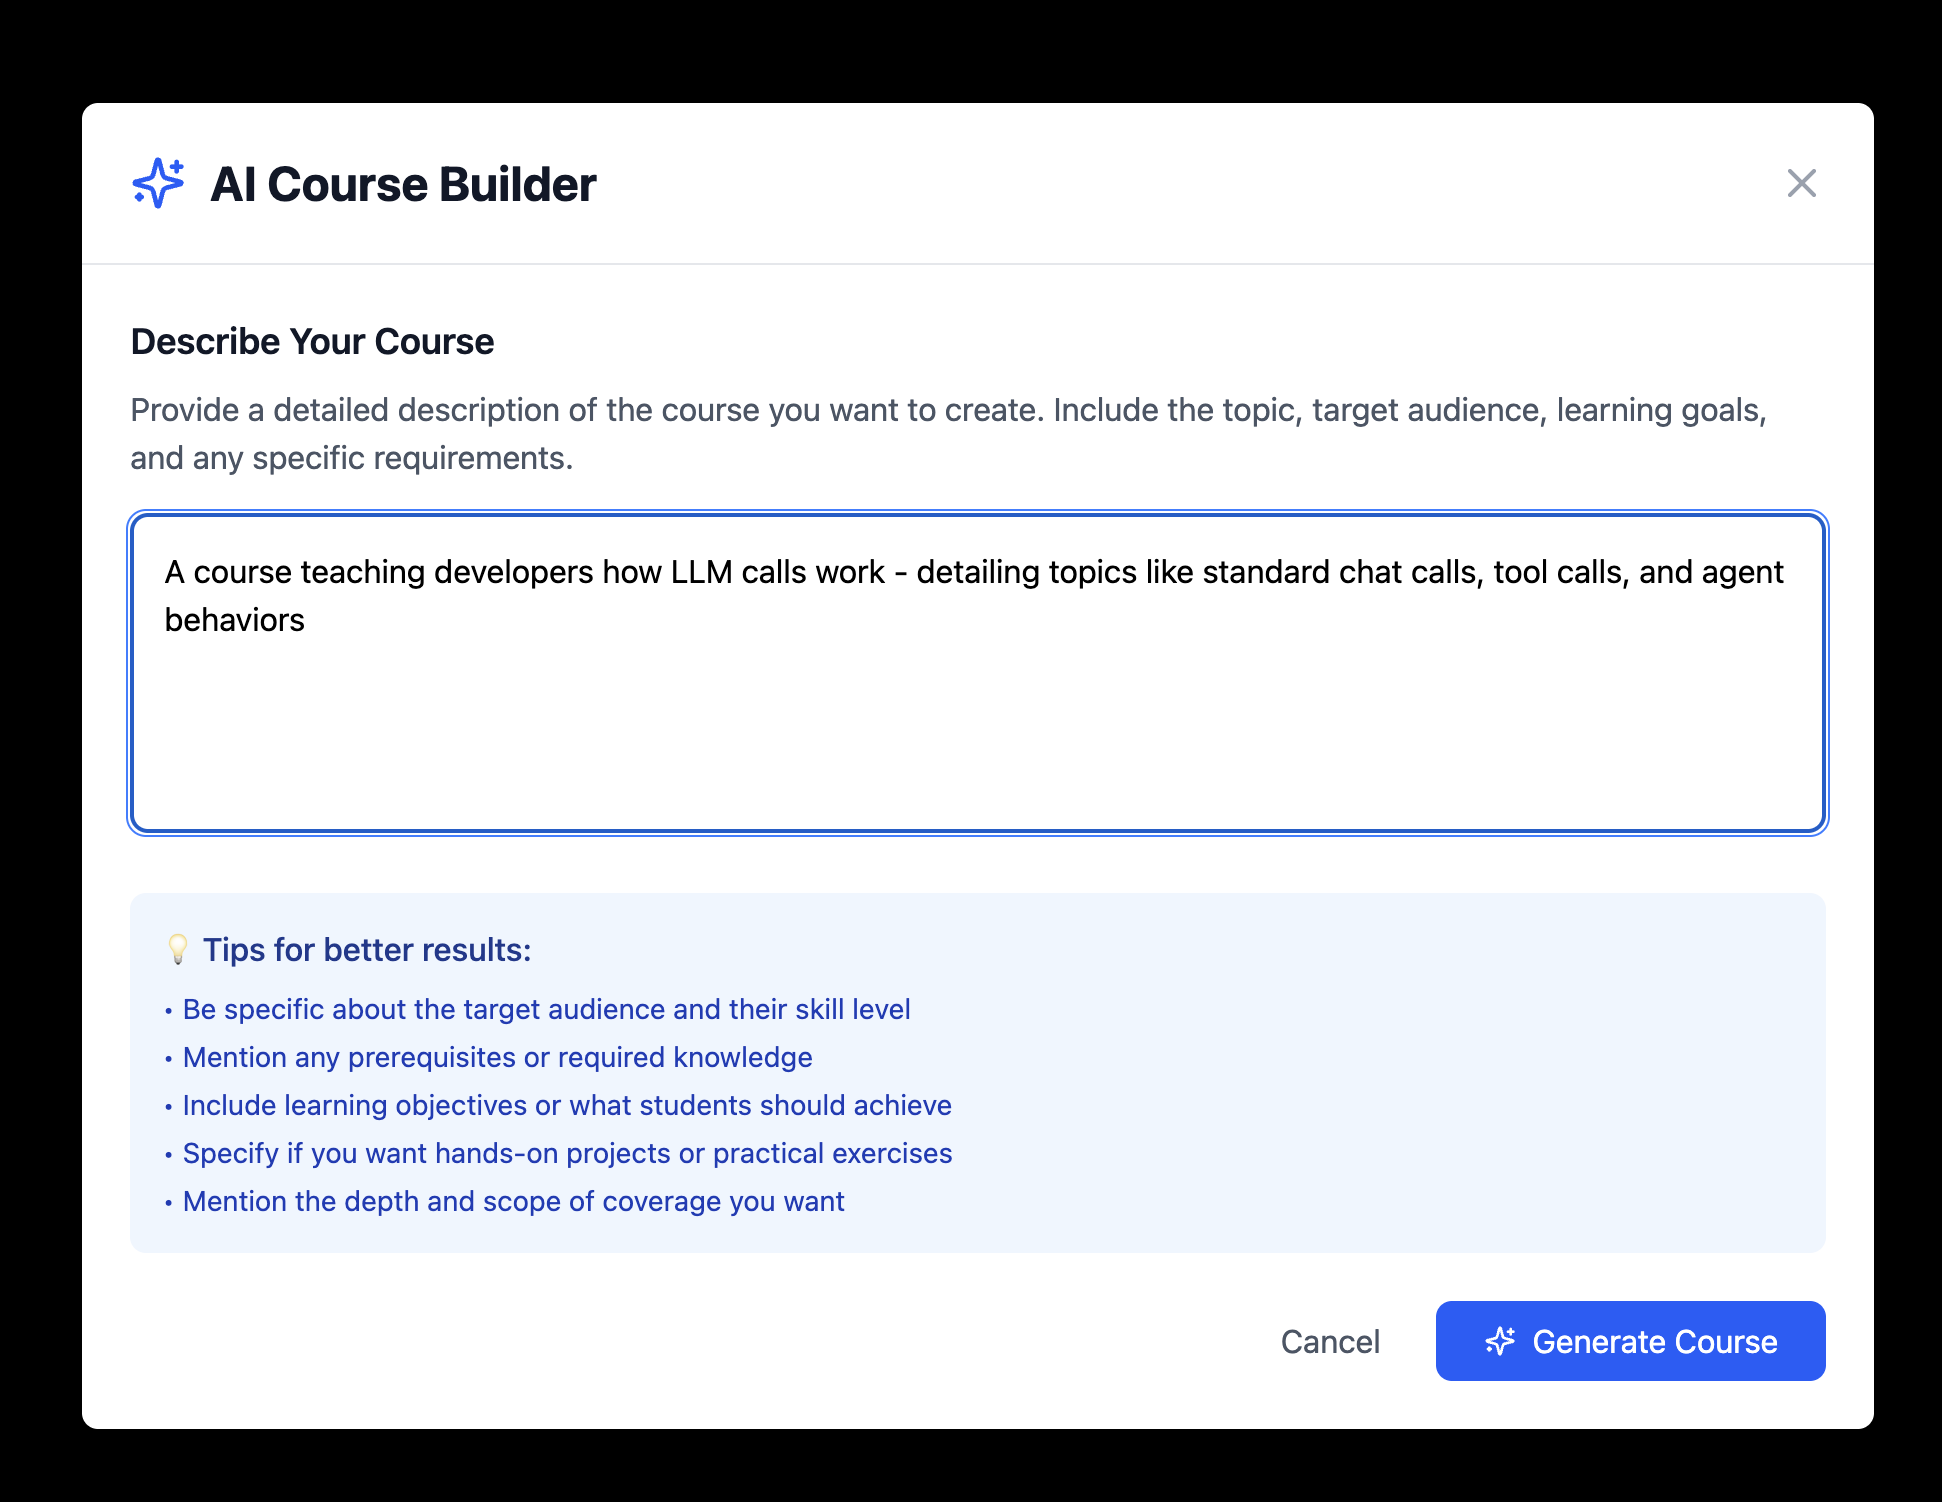
Test the Course Builder functionality
Navigate to the Course Builder and select the “Create Course” button on the top right. Fill in a prompt for a lesson you want to create a course for. Seriously, it doesn’t matter.
-
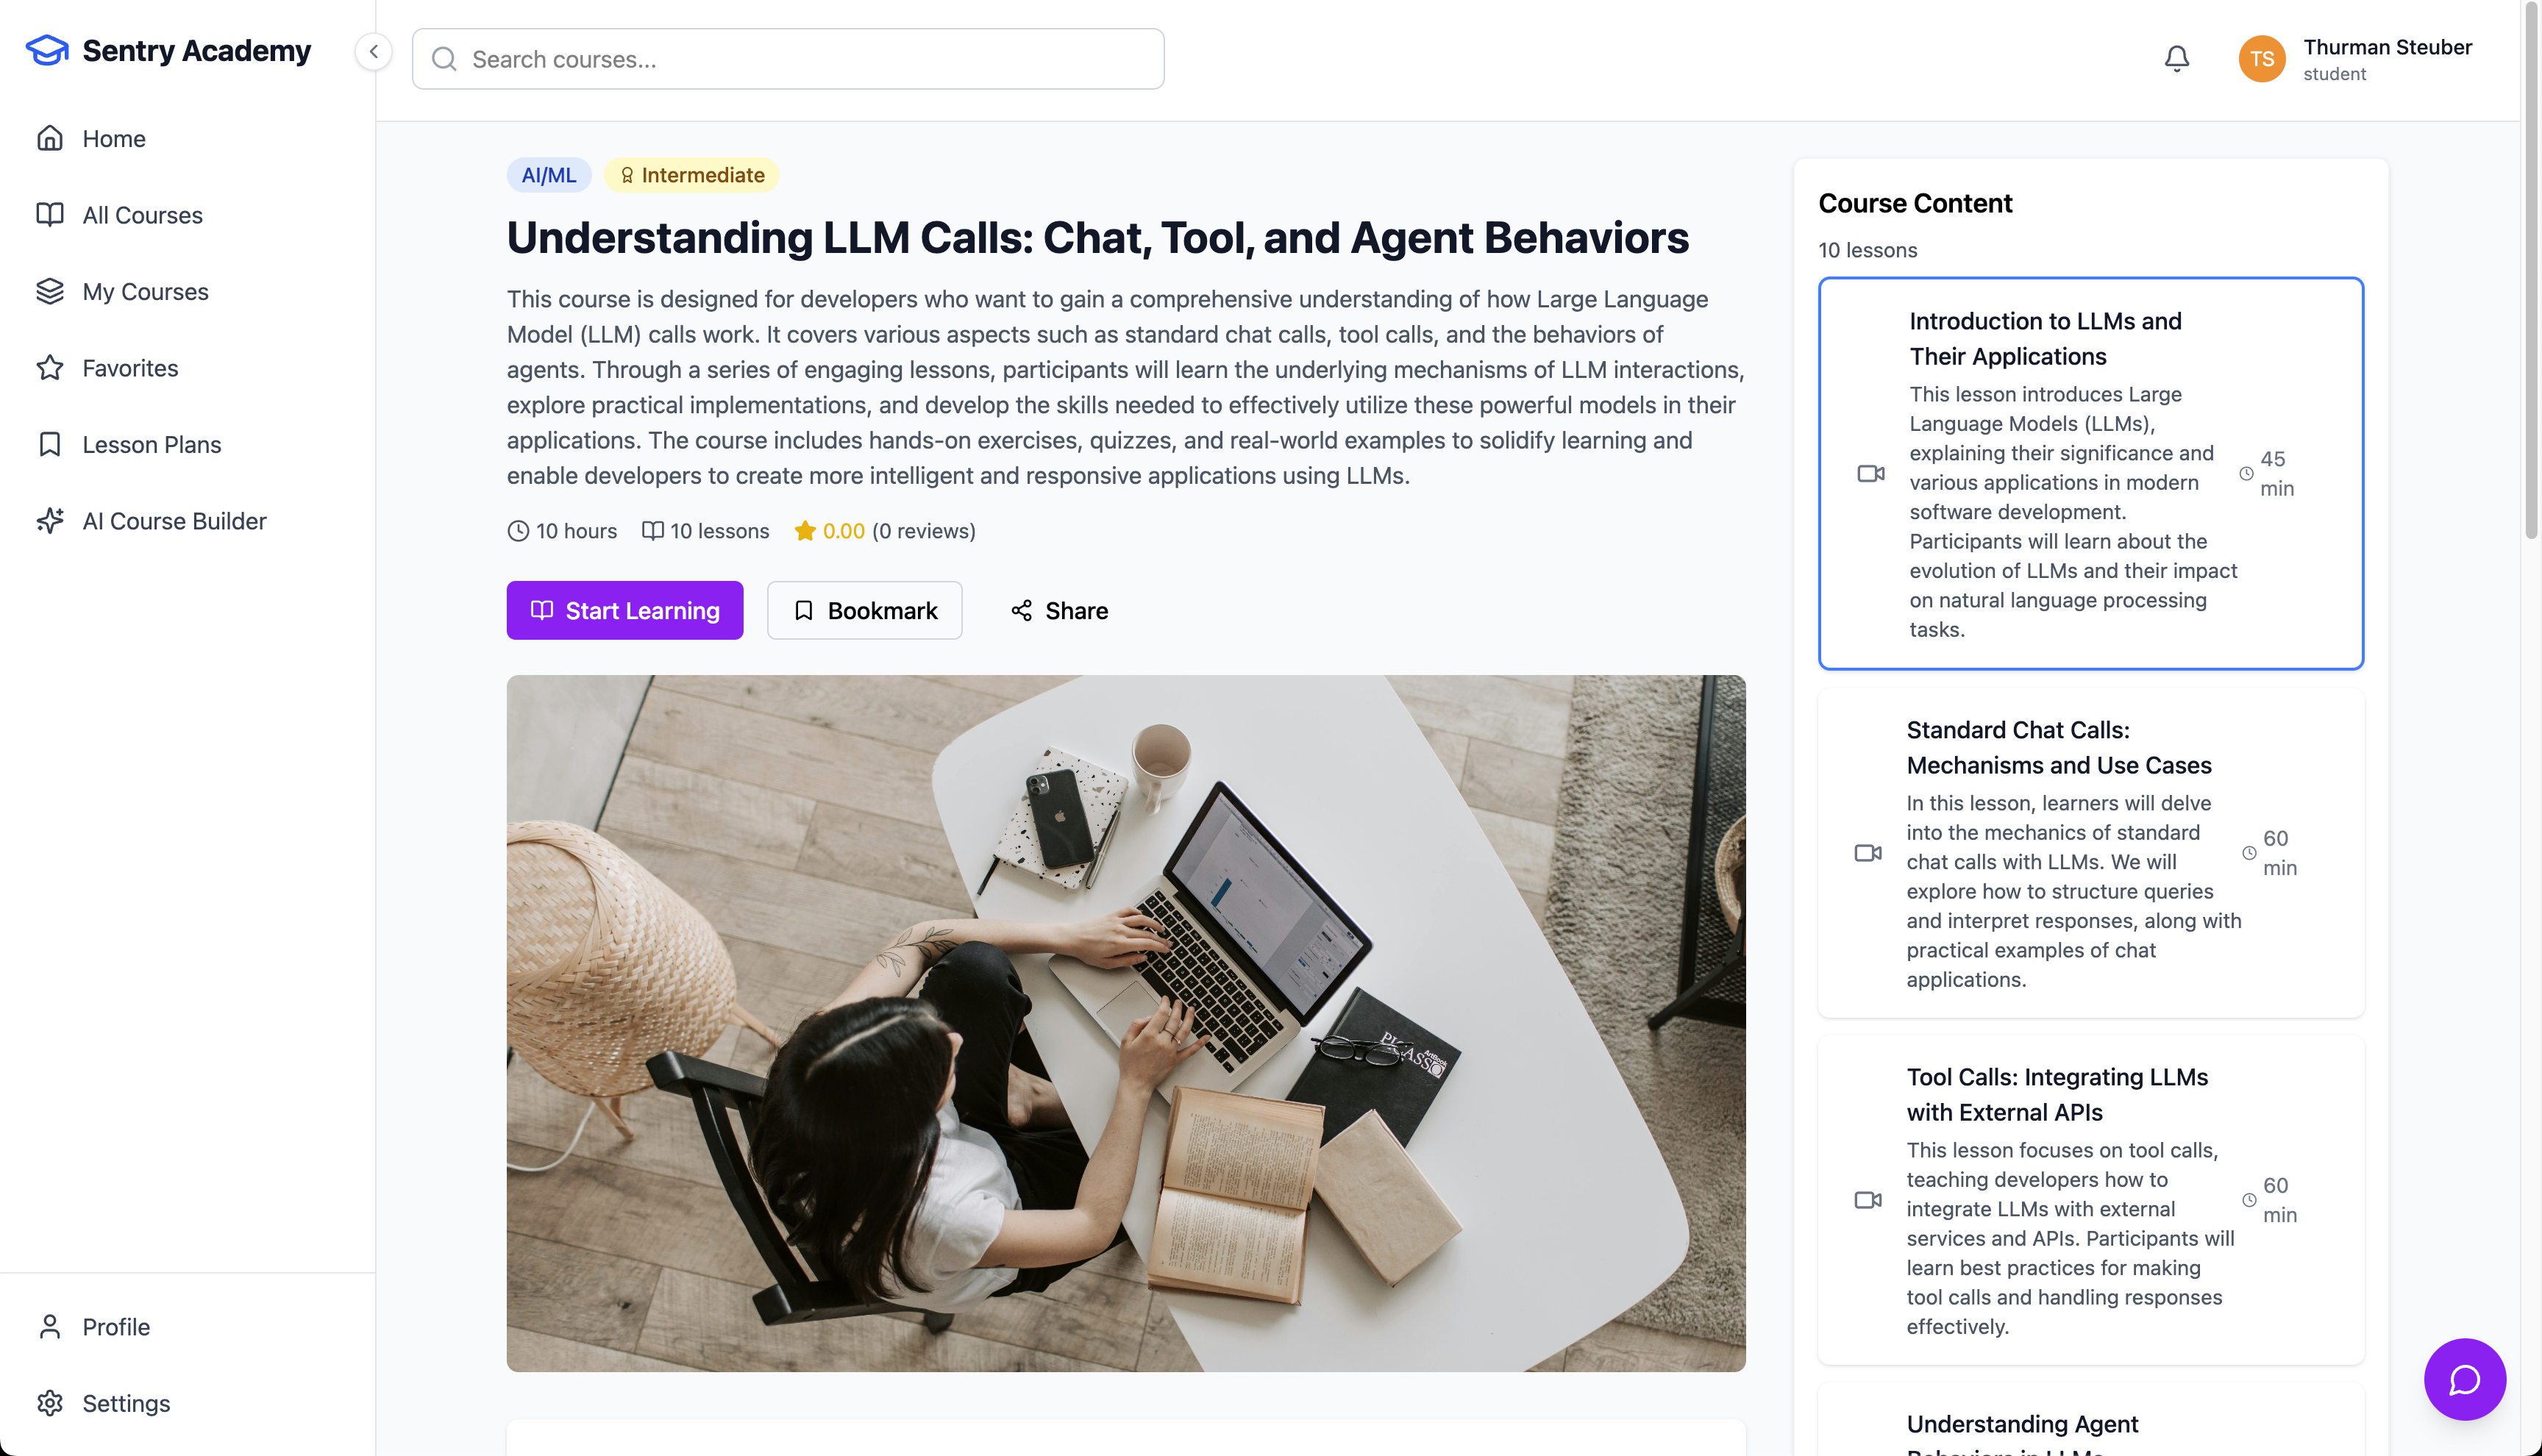
Review the created course
After a few moments, the course will be created successfully. You’ll be able to see the course in the list, and click in to review the topics it covers.
Reviewing AI Agent Monitoring in Sentry
-
**Return to Insights > AI Agents **
Navigate back to the
Insights > AI Agentsview for your project, and when you scroll to the bottom you’ll see updated values with the new call available.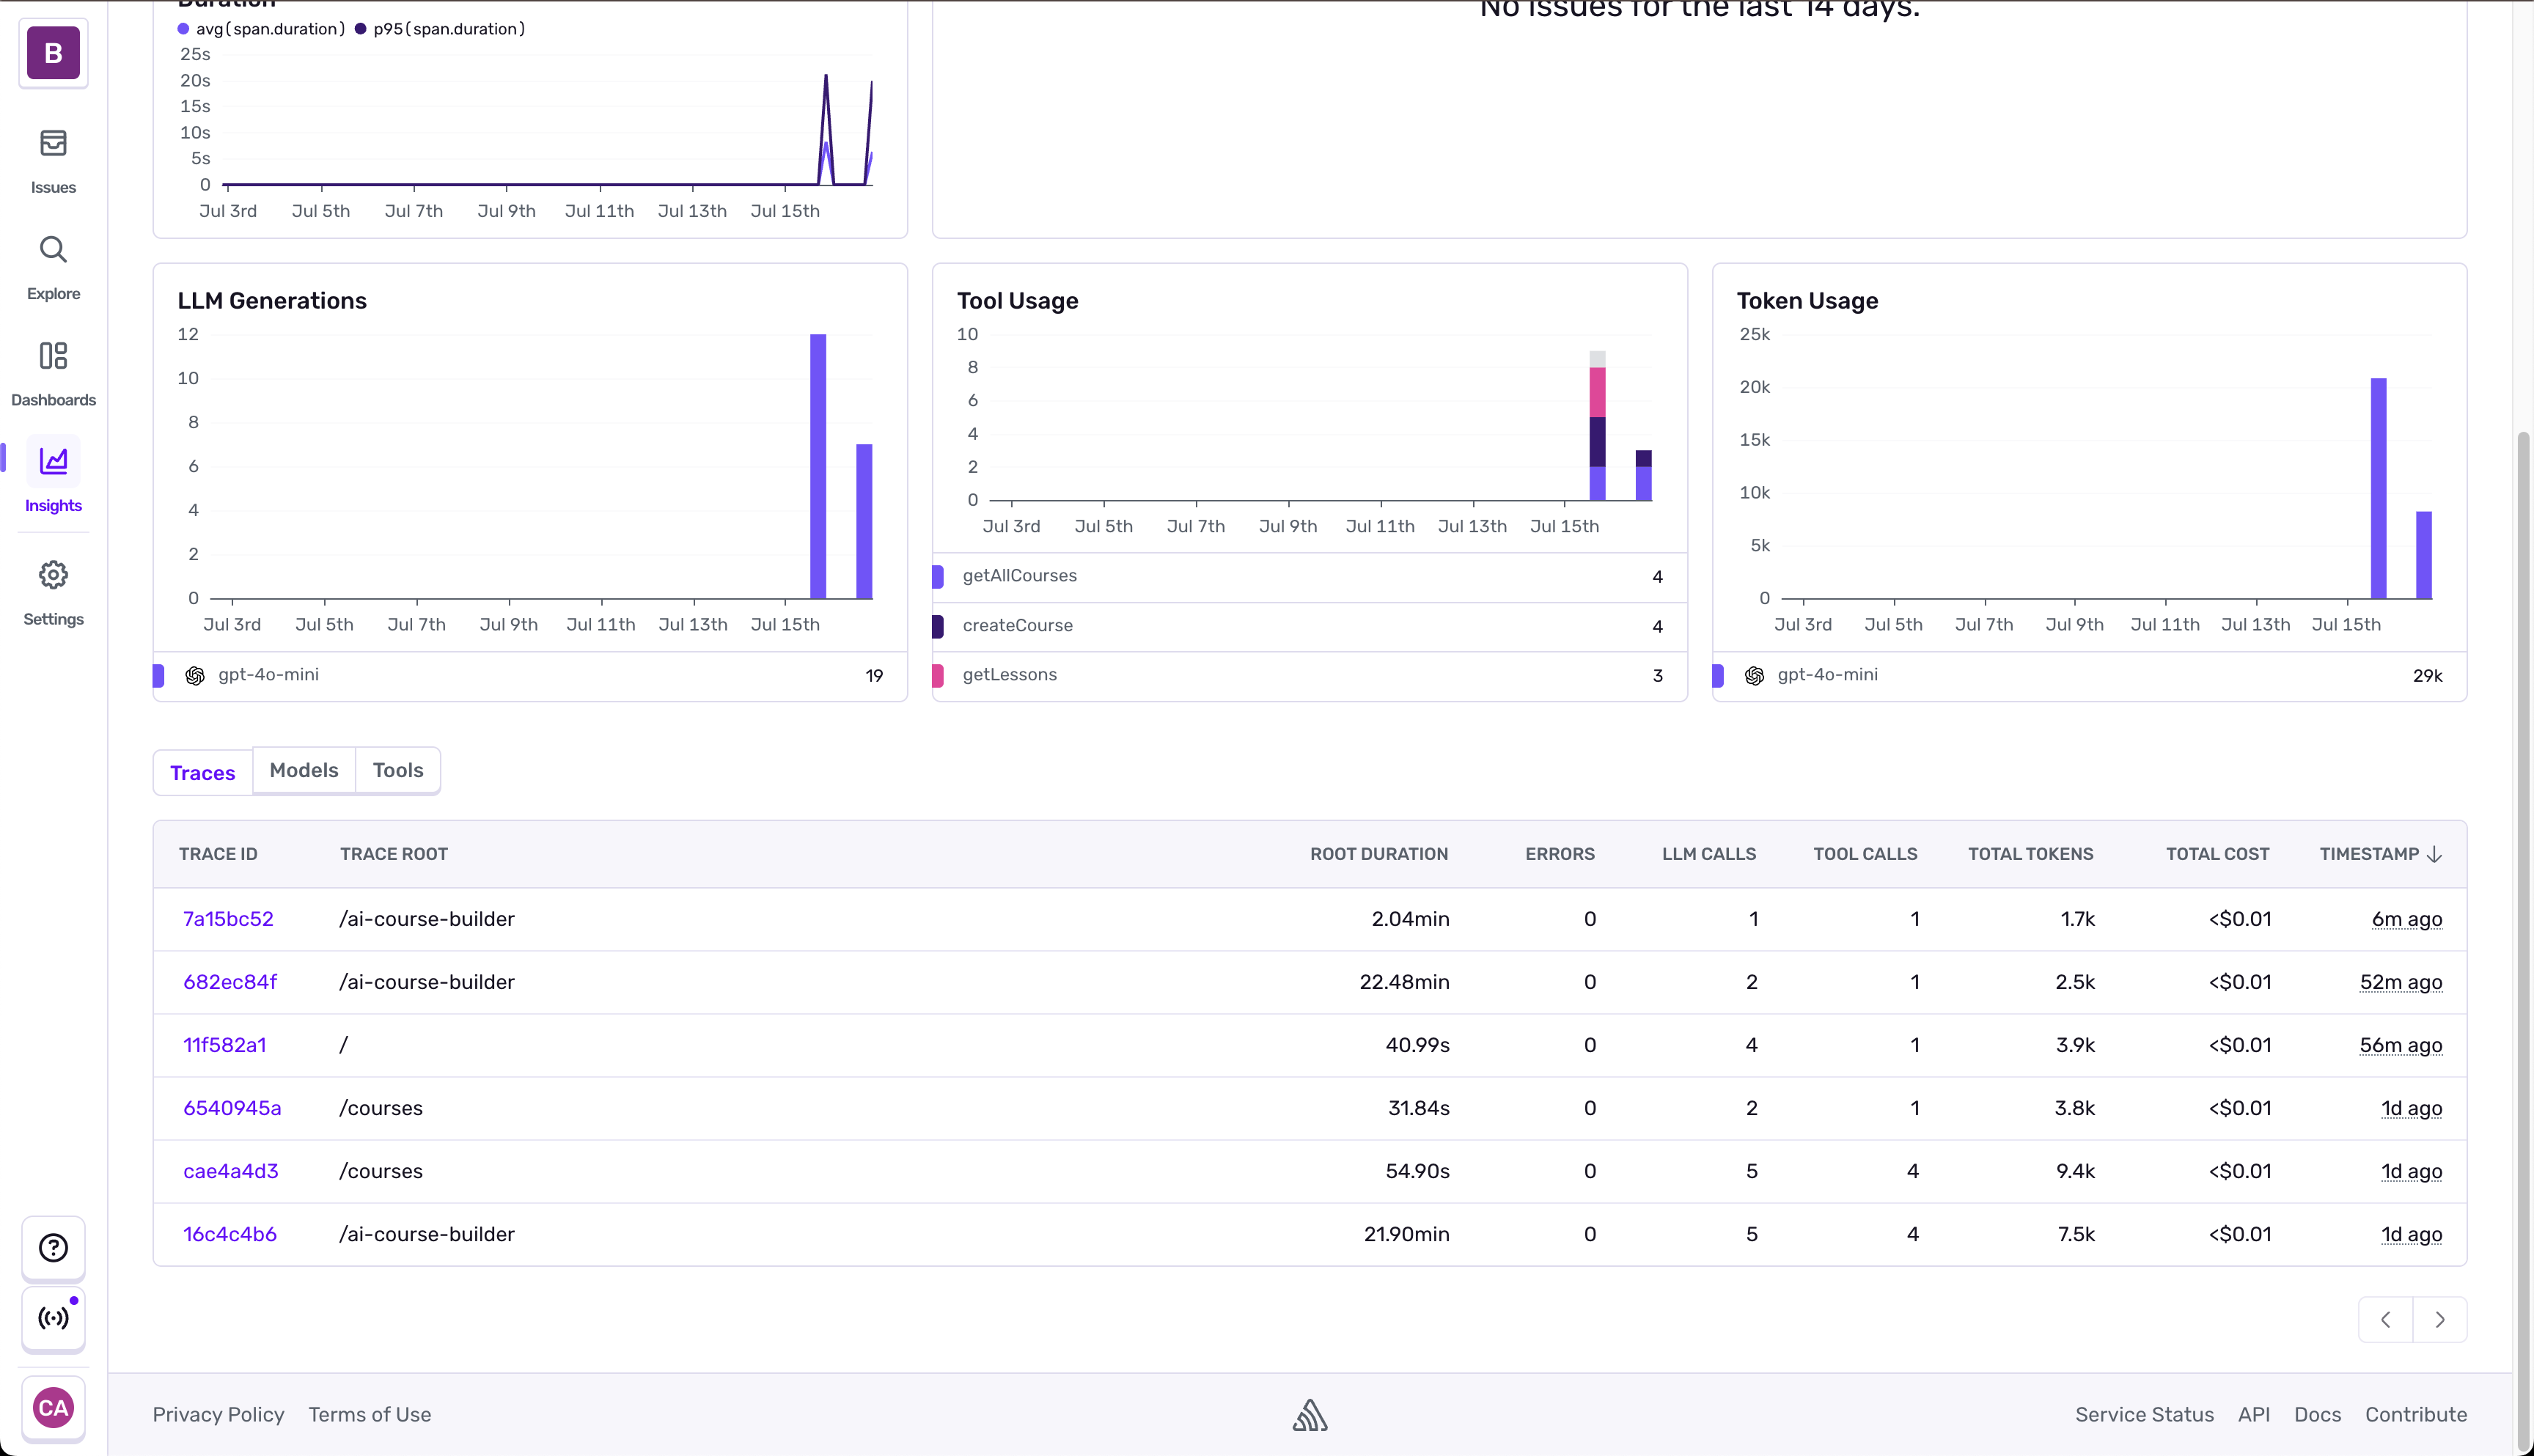
-
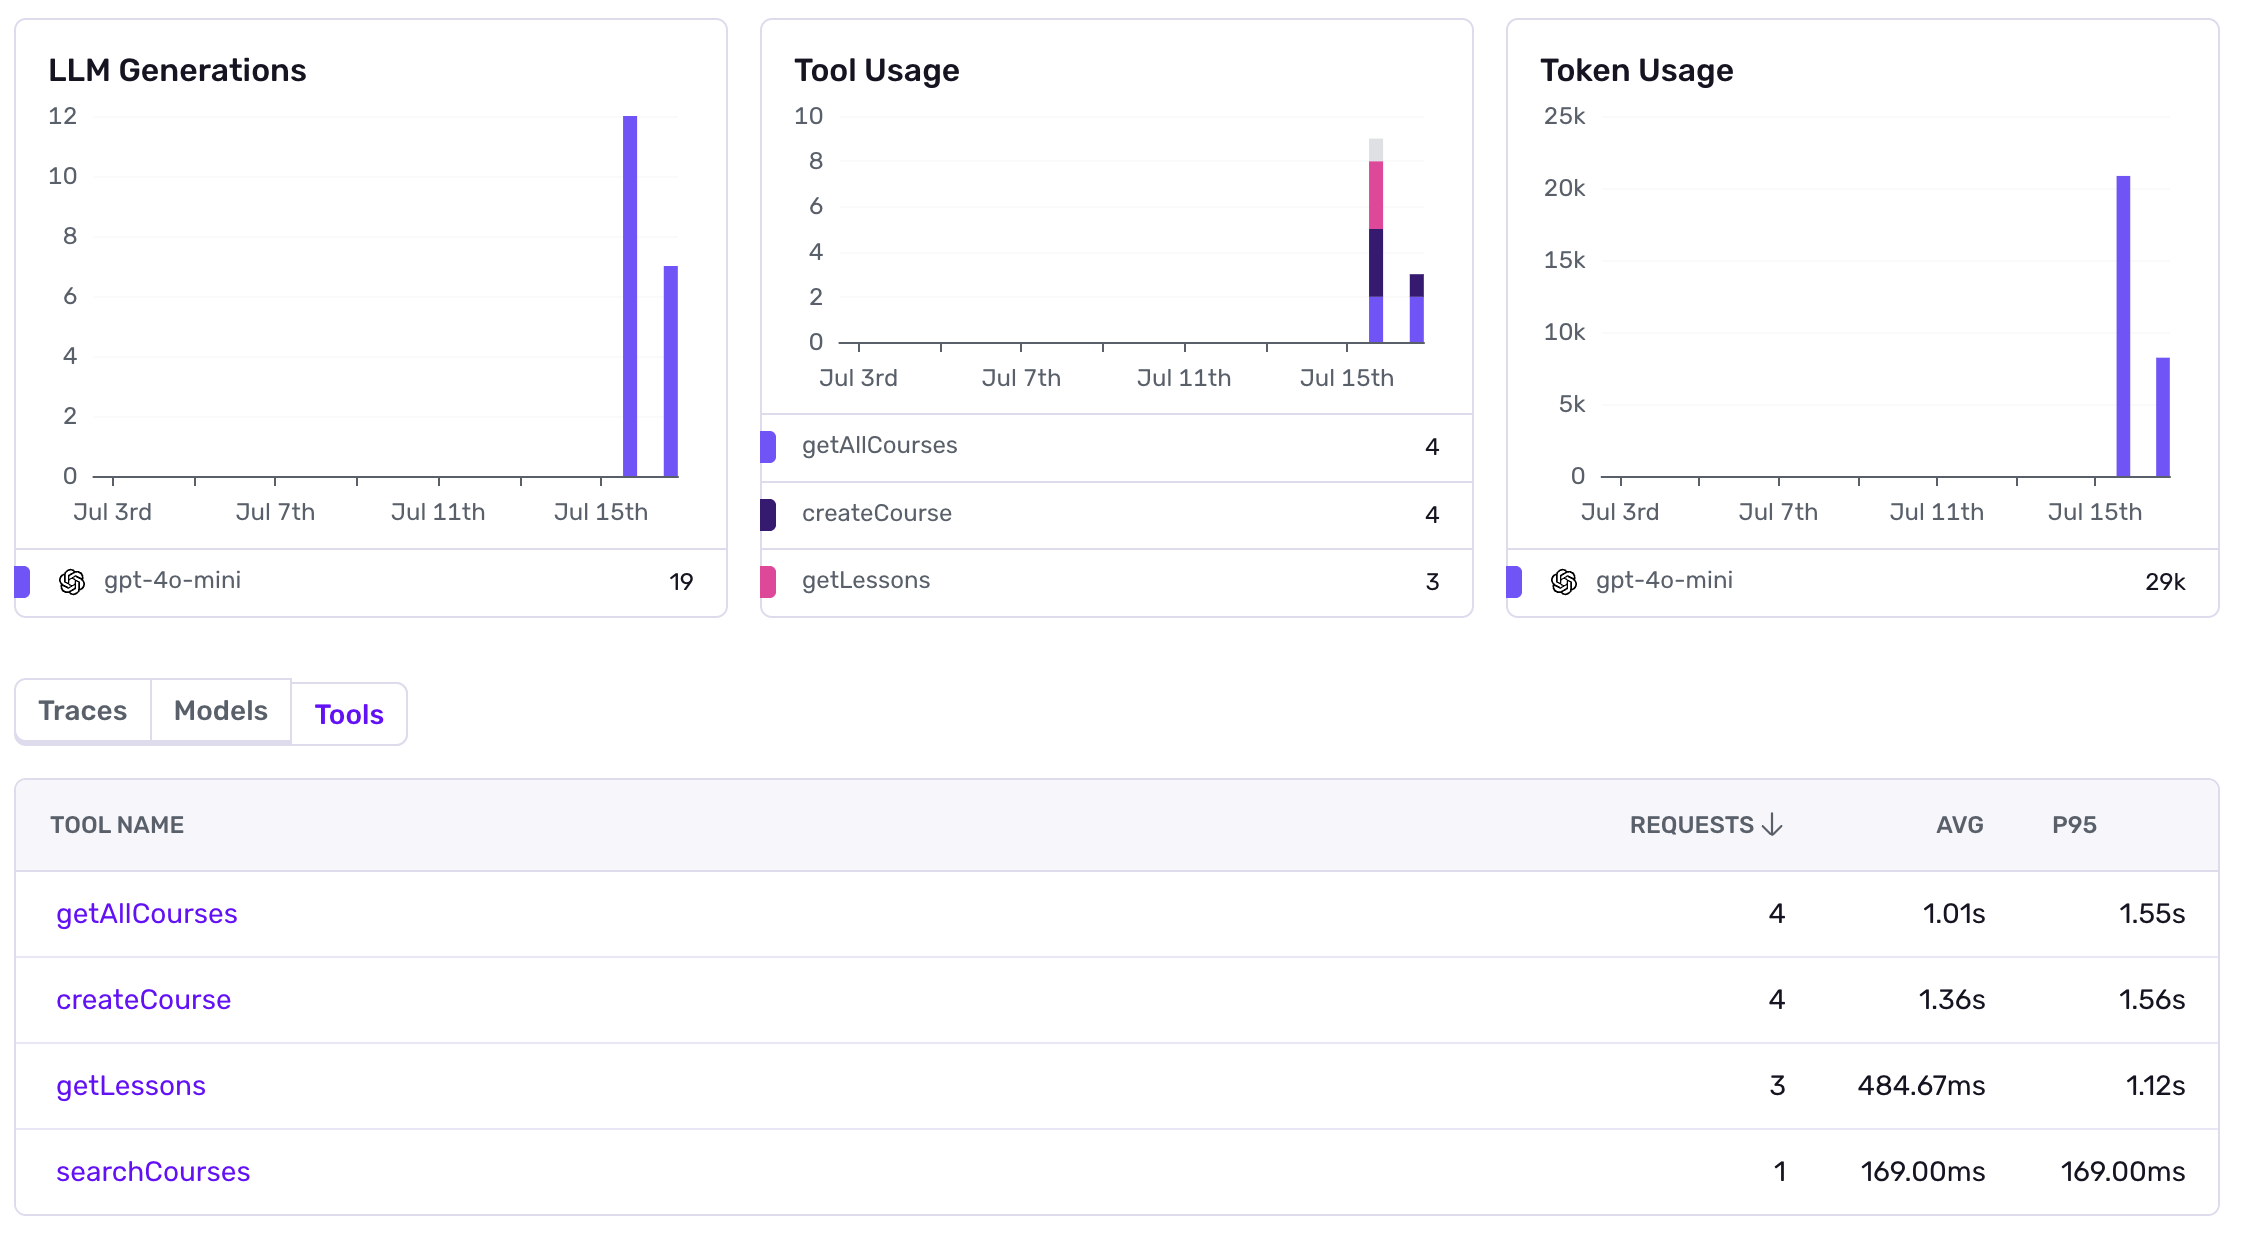
Viewing Tool Calls
Selecting the tools tab shows us statistics for the different tool calls that have been made. When we dive into any of these we’ll be dropped into the Trace Explorer where we can query and search across all the traces in the environment.
Summing Up Agent Monitoring
AI Agent Monitoring in Sentry gives you a connected view across everything happening in your application; including the inner workings of the Agents. You can use it to understabnd how model changes are impacting token usage, how your adjustments are impacting the performance of LLM calls, and even run comparisons across different model performance.
The simplified trace view lets you understand the different parameters going into your LLMs and the outputs being returned from those calls - making it easier to debug the weird interactions that LLMs have today.